

How Hard (or Easy) is it to Harvest 100,000 Ballots in One Major County?
A data-driven investigation specifically tailored to meet the intellectual demands of those who believe it is impossible to defraud American elections, with Orange County, California, as my canvas.

One of my favorite locations for events in the past four years has been Orange County, California. That county was one of the last urban Republican holdouts in the Golden State until it flipped in 2016, although signs of life are present throughout California’s chaotic electoral environment. The county, unlike many in California, has continued to grow, although at smaller rates. Only recently has it been estimated to be losing population in light of the COVID-19 fiasco.
Orange County was presidentially red in every election between 1940 and 2012. The county generally produced an increased ballot count election after election starting at the turn of the century, with one exception (2012):
Total Ballots
2000 970,905
2004 1,075,399
2008 1,153,687
2012 1,122,664
2016 1,197,521
2020 1,522,113
2024 1,391,307
It certainly comes as no surprise that the man who gathered over “81 million votes” benefited from the single biggest surge in the history of the county, when Orange sprouted 324,557 net new ballots from 2016 to 2020, only to see his successor plummet 8.6% in 2024. Keep in mind, ladies and gentlemen, that Kamala Harris lagged Joe Biden by over 1.8 million “votes” in her own home state, while Trump barely gained from 2020 at all statewide while declining in Orange by 21,683 votes (Harris was down 122,278 in the county from Biden).
Where the hell did all these votes go? Thanks to Cherisse, my indispensable research ace, I’ll show you.
Harris lost net votes from Biden in 33 of Orange County’s 35 municipalities:
· Anaheim (-16,793)
· Santa Ana (-15,711)
· Irvine (-11,847)
· Rancho Santa Margarita (-10,310)*** - appears to have new boundaries
· Huntington Beach (-7,510)
· Fullerton (-5,811)
· Garden Grove (-5,052)
The impact of Harris’ plummet is that Trump came within 2.7% of winning the county (he won Riverside and San Bernardino Counties for the first GOP presidential wins since 2004), and flipped Garden Grove, Mission Viejo, and Brea.
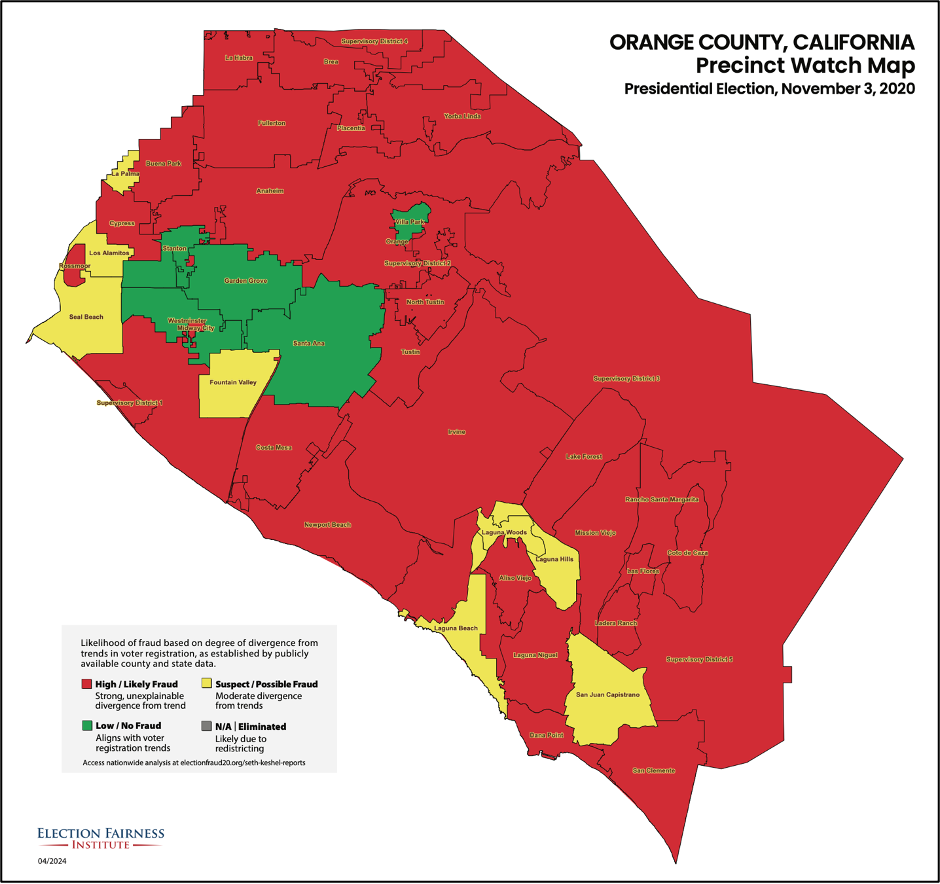
Looking at my 2020 research below, you can see where I’ve spotted likely ballot harvesting activities intended to bloat Biden’s popular vote tally and ensure the Democrats won as many House seats as possible in the area (those are in red). My research accounted for 14 municipalities (including unincorporated Orange County, in which it is likely Biden’s ballot count exceeded forecasts by at least 3,000).
The average Democrat vote tally in Orange County since the flip has been 705,234 in three cycles (Clinton, Biden, Harris). Harris lagged Biden by 122,278, as mentioned earlier, coming in below the average mark and making me question:
Where did those extra 100,000 votes come from in 2020?
Well, it seems like they didn’t have any interest in voting in 2024, even though the voter roll had increased by 89,310, signifying increased potential participation:
Total Registered Voters
2020 1,772,700
2024 1,862,010
How hard would it be to get back 100,000 of Biden’s ballot count for Harris, now that we know that is possible based on the growth of the voter roll and also because Trump didn’t exceed his own 2020 vote total (a key driver of one party declining in votes year after year is the growth of the other party, and the flipping of previously held votes)?
Anaheim
Population: 346,824* (2020 official)
Need: 16,793 ballots
How: Hire 200 ballot harvesters, assign them to collect 84 ballots each, and pay them $30 per ballot.
Cost: $2,520 per ballot harvester.
Human Resources: 1 of 1,734 Anaheim residents would need to become a paid ballot harvester.
Scope: Focus on low-income housing throughout the urbanized city, the 10th most populous in California.

Santa Ana
Population: 310,227* (2020 official)
Need: 15,711 ballots
How: Hire 200 ballot harvesters, assign them to collect 79 ballots each, and pay them $30 per ballot.
Cost: $2,357 per ballot harvester.
Human Resources: 1 of 1,551 Santa Ana residents would need to become a paid ballot harvester.
Scope: Local ballots in low-income housing throughout a city that is more than three-quarters Hispanic and increasingly less likely to vote for Democrat nominees based on national data.

Irvine
Population: 307,670* (2020 official)
Need: 11,847 ballots
How: Hire 150 ballot harvesters, assign them to collect 79 ballots each, and pay them $30 per ballot.
Cost: $2,370 per ballot harvester.
Human Resources: 1 of 2,051 Irvine residents would need to become a paid ballot harvester.
Scope: UC Irvine is one of 11 major universities located within Orange County and a major source of harvested ballots and available voter registrations to attach mail ballots (automatically sent out) to.

Remaining
Population: 2,222,268* (2020 official)
Need: 55,649 ballots
How: Hire 750 ballot harvesters, assign them to collect 74 ballots each, and pay them $30 per ballot.
Cost: $2,220 per ballot harvester.
Human Resources: 1 of 2,963 residents of the remaining areas of Orange County would need to become a paid ballot harvester.
Scope: Many municipalities, such as Huntington Beach, Westminster, and Costa Mesa, are missing thousands of ballots from Biden’s 2020 count each. These would be divided up in quotas and easily achieved based on the abundance of voter registrations.
The Total Cost
I have surmised that 1,300 paid ballot harvesters in Orange County could collect 100,000 ballots (77 each) at a cost of $3,000,000 (three million). The Harris campaign, in less than four months, raised $1.2 billion in campaign funds, or 400 times more money than I’ve parceled out here for a county that makes up nearly 1% of the population of the United States, and while being overly generous in my price paid per ballot.
It is also notable that Harris lost votes in 33 of 35 Orange County municipalities, and gained in only Laguna Woods (+21 ballots) and the unincorporated areas of Orange County; in the latter, her gain was a robust +5,747, or +16.5%, where it just happens to have an outsized impact on the many U.S. House races that hinge on Orange County. My belief about California in the 2024 election, as it is with New York, New Jersey, Illinois, Massachusetts, and Washington, is that the piling on of “popular votes” in safe blue states was discouraged because Harris needed to be portrayed as the winner of the Electoral College and not the popular vote in order for her to achieve two things:
· Avoid the scrutiny of needing 86 million votes to beat Trump, akin to the 2020 results
· Push conservatives to abolish the Electoral College, which serves as a check on Democrat urban dominance.
For those who think my mapping and math estimates are too kooky to be believed, I’ve laid out the quotas and human resources requirements right here in front of you and bounded them with historical context and government-provided statistics. Yes, it is possible to:
· Flood voter rolls with ineligible entries using Automatic Voter Registration
· Use the voter rolls and specially coded data to identify dormant registrations or perpetual non-voters
· Carve the map and assign territory to paid activists, numbering one out of thousands in a given city each.
· Use the extended mail and early voting period to achieve these quotas and assure political dominance.
Those who believe the ballot collection game, the equivalent of an adult Easter Egg hunt in only which certain kids have the data as to where the eggs are located, are fooling themselves and would be much wiser to understand exactly how data and policy are being weaponized against them. Until lawless states like California are brought to their knees, you can expect politicians to act as if there is no electoral check against them – because there isn’t.
Seth Keshel, MBA, is a former Army Captain of Military Intelligence and Afghanistan veteran. His analytical method of election forecasting and analytics is known worldwide, and he has been commended by President Donald J. Trump for his work in the field.
Brea! A lot of first generation Chinese and Indian Americans voted Trump here. If you’re ever back in the OC, dinner’s on me at the fantastic Brea Chophouse.
This is prima facie evidence of the theft in 2020. However heuristically, I still think they stuffed the ballot box for Harris in 2024. The evidence is all the late breaking house seats they stole (again).