

National Recap - 2024 Election Compendium
Topic: 2024 Election Analysis

National 2024 Presidential Election Review
Author’s Note: All 2024 Election Reviews can be found here.
Outcome
Trump +1.5% (+2,284,316)
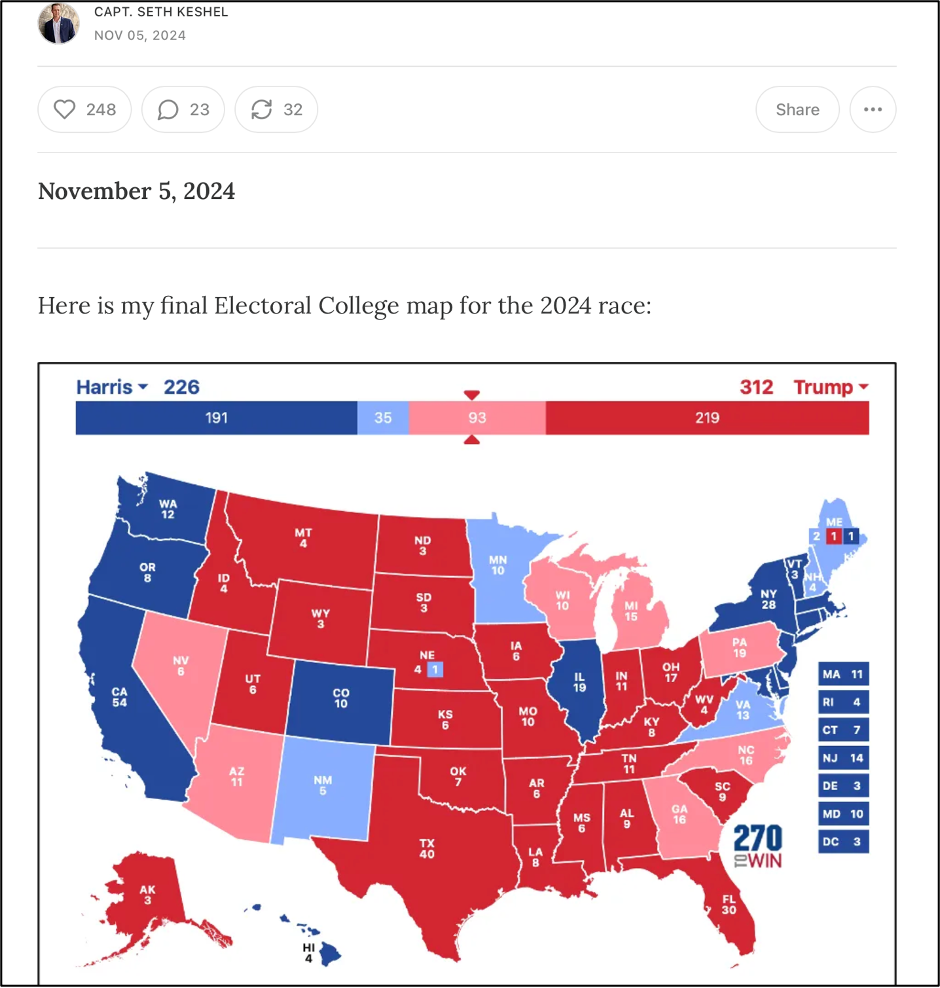
Trump 312 Electoral Votes
Harris 226 Electoral Votes
Trump 312 Electoral Votes
Harris 226 Electoral Votes
Preface
Even though this entry summarizes 3,143 counties and independent cities, this final entry into the 2024 Election Compendium doesn’t require great length. I have already covered every state in depth beginning in late November, when ballots were still being counted in some states, particularly in the western reaches of the country. I recommend you browse those reports at your convenience if you desire greater detail into what is captured here.
My insight into the 2024 election drew great interest, especially from the New York Times, which profiled me and my methodology in October. That piece is one of my favorite things to have happened to me in recent years, because it turned out that I’ve never been more right about a more important thing in my life, and I was right in all 56 races for electoral votes nationwide (please note that I solidified my predictions of Georgia and Michigan to Trump in the final approach to Election Day). This interest was owed to the fact that I am one of few prominent election voices who factored traditional political measurements in with what I believed to be each state’s own internal capacities to either facilitate, or become vulnerable to, widespread election manipulation.
The election came and went, and Trump managed to punch through what appears to be much more precisely focused manipulation this time around. It turns out, much to the chagrin of the magicians and sorcerers consulted by the mainstream media, that I was right. This final entry will review some facts, figures, predictors, and indicators that came to pass in the 2024 election.
Analysis
· In the New York Times piece, Lakshya Jain of Split Ticket had this to say about voter registration by party analysis as he defended the dark art of polling:
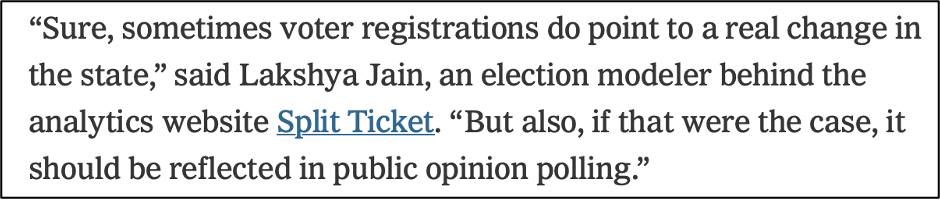
“Sure, sometimes voter registrations do point to a real change in the state,” said Lakshya Jain, an election modeler behind the analytics website Split Ticket. “But also, if that were the case, it should be reflected in public opinion polling.”
No comment from Mr. Jain on Ann Selzer’s final Iowa poll.
· 30 states plus Washington, D.C., register voters by party. All 31 of those, plus the other 20 states, became more Republican, or less Democrat in the results by percentage margin from 2020, with Trump flipping six states. Mr. Jain, who was all in on the polling instead of the registration data, should know that the party registration indicator was accurate in 29 of the 31 states (or D.C.) registering by party. Washington D.C. was slightly less bad for Trump than it was in 2020 despite moving 0.5% left by registration, and Colorado was 2.5% less bad for Trump despite shifting a measly 0.05% left by registration. Translation – voter registration by party analysis is still the king of determining shifts in presidential elections, and anyone still promoting mainstream polling is a damned liar. The few honest pollsters out there reading this know exactly who I’m talking about. Hat tip to Richard Baris, the most accurate pollster of 2024, and Mark Mitchell of Rasmussen Reports.
· Here is how accurate voter registration by party analysis was in each of the states in which county-level registrations are available (excludes Alaska, Utah, and Washington, D.C.):
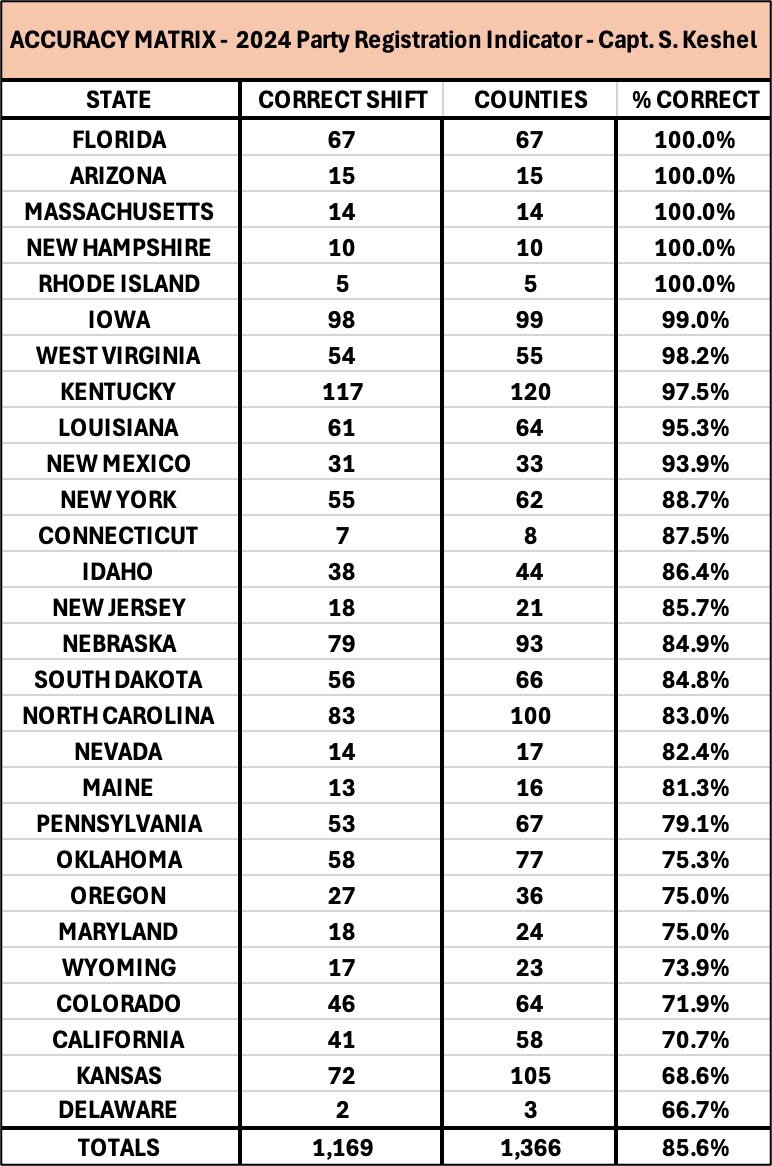
· As indicated in the chart above, voter registration by party analysis was 85.6% correct in a sample of 1,366 counties in forecasting whether the shift of a county would be to the right or left. It was perfect in five states, including all 67 counties in Florida, all 15 in Arizona, and all 10 in New Hampshire, nearly perfect in Iowa’s 99 counties, and at least 75% accurate in all but 5 states. Many of the misses were attributable to Trump’s strength overrunning what appeared to be Democrat shifts on the way, such as in 17 counties in California; in other cases, such as in Kansas, Oklahoma, or Nebraska, depopulation and the issue of being maxed out creating statistical noise and shifting some counties to the left in the vote results as a technicality, not an organic trend. Where there are inconsistent misses aligns with areas I found the most suggestive indications of election manipulation – like Pennsylvania, Maine, or North Carolina.
· When I set out to assess the quality of the 2024 election, I issued a reference guide as to how I would be doling out the final grades pertaining to each state’s 2024 election quality. The key to the evaluations system is consistency, so I reserved the most severe ranking, Grade of 4 – Highest Concern, for five states (the top 10%). Readers may disagree on some of the minutiae, but this is the best model I could create to account for the existence of state law which accounts for the permanent “baking in” of ballot count and the fact that new manipulation and methods of cheating were strategically employed to alter not only the presidential race, but down ballot races, as well. 18 states received a Grade of 1 – Lowest Concern, 16 states, and Washington, D.C., received a Grade of 2 – Marginal Concern, 10 states received a Grade of 3 – Elevated Concern, and 5 states, as mentioned previously, received the most severe grade. These grades are depicted below:
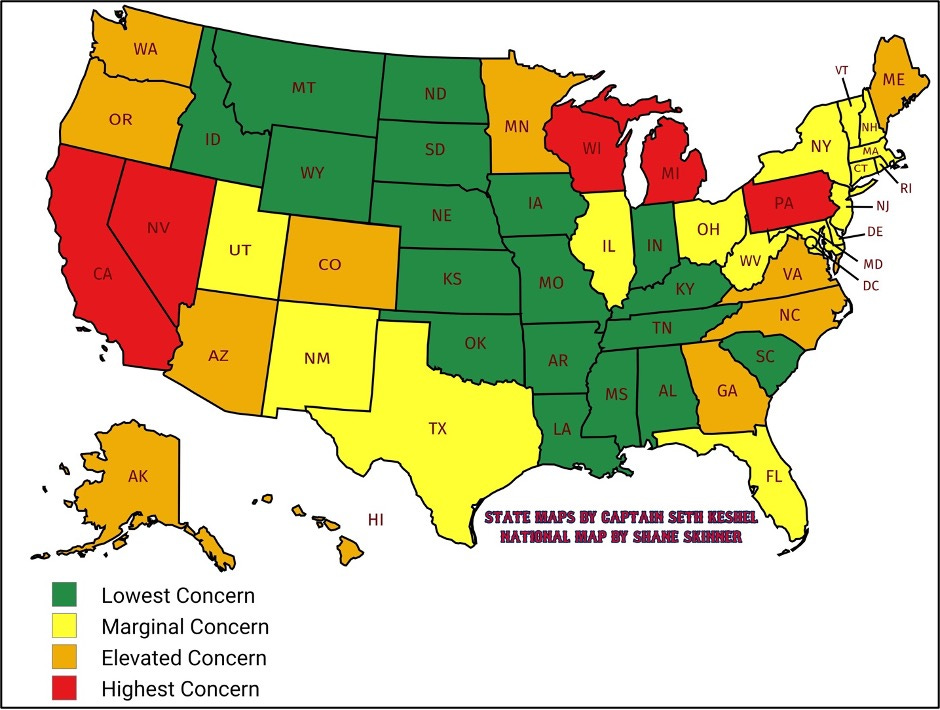
· Here is how these states (plus Washington, D.C.) shook out regarding winners:
Grade of 1 – Lowest Concern: Trump 18, Harris 0
Grade of 2 – Marginal Concern: Harris 12, Trump 5
Grade of 3 – Elevated Concern: Harris 7, Trump 4
Grade of 4 – Highest Concern: Trump 4, Harris 1
· In a future post, I will assess the topic of exactly what it is that makes states blue based on the findings of my 2020 and 2024 election fusion analyses. As for the 2020 and 2024 elections, the most likely indicator of a blue state is the presence of Automatic Voter Registration:

· The graphic on Automatic Voter Registration confirms that flooded voter registration rolls is the single most significant hallmark of a blue state. In 2020, the disparity between Biden and Trump was wider (243 electoral votes to 9), and shrank this year only because Trump managed to outrun the cheat in Georgia, Pennsylvania, Michigan, and Nevada.
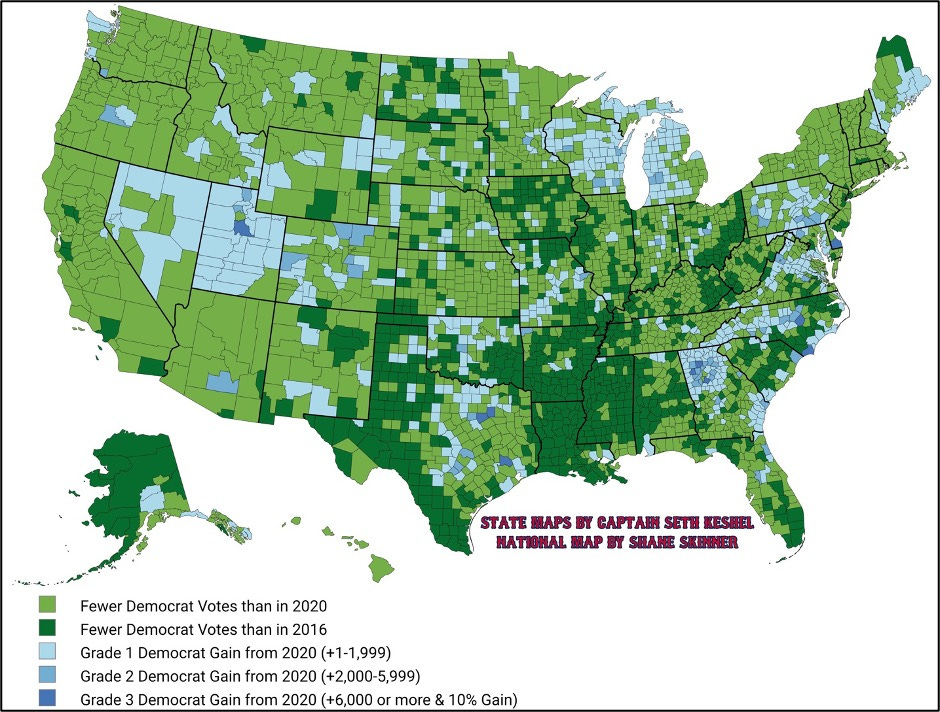
· The three-cycle contrast map, which takes into account all three of Trump’s elections, is shown above. Harris’ gains over Biden are shown in blue and shaded accordingly to show the magnitude of the gain.
· Harris lagged Biden in every state for net new votes except for Georgia, Maine, Nevada, North Carolina, Utah, and Wisconsin, which represent four critical battleground states and another with a key U.S. House race (ME-2). Harris gained ballots over Biden in just 647 county equivalents out of 3,143 possible (20.6%) and lagged him in 2,496 (79.4%). She failed to reach even Hillary Clinton’s ballot count in 884 counties (28.1%), and those counties are most prevalent in the South and Midwest.
· At 77,303,573 votes, Trump gained 3,079,598 net votes over his 2020 national total. Harris, at 75,019,257 ballots, lagged Biden by 6,264,244 net, for a total swing of 9,343,842 toward Trump.
Most Suspect Outcomes
· U.S. Senate
Tammy Baldwin over Eric Hovde, Wisconsin
Elissa Slotkin over Mike Rogers, Michigan
Jacky Rosen over Sam Brown, Nevada
Ruben Gallego over Kari Lake, Arizona
· U.S. House
Jared Golden over Austin Theriault, ME-2
Eugene Vindman over Derrick Anderson, VA-7
Adam Gray over John Duarte, CA-27
Derek Tran over Michelle Steel, CA-45
Closing Commentary
The Top 10 Election Integrity Targets in The United States are (in no order):
Georgia (16 electoral votes)
North Carolina (16 electoral votes)
Virginia (13 electoral votes)
Pennsylvania (19 electoral votes)
New Jersey (14 electoral votes)
New Hampshire (4 electoral votes)
Michigan (15 electoral votes)
Wisconsin (10 electoral votes)
Nevada (6 electoral votes)
Arizona (11 electoral votes)
The Top 10 List above is merely for the sake of consistency and to ensure Americans can achieve the bare minimum of competing in presidential elections with an outsider candidate from the populist right as their nominee. I know patriots and freedom fighters from the other 40 states, and even Washington, D.C., who think their state should belong on that list – but alas, there can be only 10 on any Top 10 List, and those 10 will return a good guy to the White House and provide room to grow.
Still, New York, California, Illinois, and other states showed tremendous promise if two things can be sustained:
· Demographic shifts achieved by organic voting trends in 2024
· Continued pressure for election reform, both at state and federal (executive) levels
There is a tremendous risk that, now that Trump is poised to return to the White House in just over one week, Americans will forget all about election integrity, shrug off the 2020 presidential debacle and the past two midterm elections, and chalk all the issues up to a sort of political bad dream. This must not happen, and it is why many are calling for President Trump to launch an election reform committee to uproot the illegitimate and disenfranchising election practices enshrined in law throughout the country.
It is my assessment that President Trump won this election over manipulation that was much more focused than in 2020, when it could be spotted all over, even in solid red and solid blue states. Since no one would have believed Trump would have more than 77.3 million votes and Harris, the most unpopular modern Vice President ever, would top Biden’s 2020 ballot count, it is clear the Harris may lose the popular vote and win the Electoral College narrative was intended to hoodwink Americans into believing such an outcome was possible in the middle of a coalition shift in which the working-class vote was shifting heavily rightward.
That narrative is why we see ballot harvesting relaxed in California, New York, Illinois, and New Jersey, which is responsible for the loss of overall ballots for Harris, bringing her well below Biden, and the tightening of margins but incredible numbers that we didn’t see in working class states like Pennsylvania or Wisconsin that Harris needed to win. Still, despite hemorrhaging minority support and working-class white support nationwide, she nearly matched Biden’s gaudy ballot counts in Michigan and Pennsylvania, and exceeded them in Wisconsin, Georgia, North Carolina, and Nevada, which coincidentally happen to be states anyone with a brain, including the online pundits who mocked me for assessing ballot fraud potential, knew would be decisive states.
And on that matter, it was Logan Phillips who had this to say to the New York Times when asked about my methodology:
“If he ends up getting some things right, I think it’s going to be out of luck,” said Logan Phillips, an election forecaster from Race to the WH, a site that predicts elections and tracks polling.
The problem of this model is it’s based off assumptions that are just misconceptions of what happened in 2020,” Mr. Phillips said.
Well, Logan, it turns out only one of us had a working model, and I’m still waiting for you to congratulate me on my “lucky” final prediction:
This concludes my comprehensive review of the 2024 Presidential Election, with consideration of down ballot impacts.
Seth Keshel, MBA, is a former Army Captain of Military Intelligence and Afghanistan veteran. His analytical method of election forecasting and analytics is known worldwide, and he has been commended by President Donald J. Trump for his work in the field.
So I walk into a bookstore and ask an employee for the latest book on Trump's plan to deport all the illegals.
She replies: "GET THE HELL OUT OF HERE & DON'T EVER COME BACK!"
I said: "Yes! That's the one! Do you have it in paperback? "
😁
I just emailed this to Donald J. Trump. You are his next election integrity guru. No doubt in my mind. Hang tight soldier! Thank you for all you’ve done for America and educating the people! God Bless!