

New Hampshire - 2024 Election Compendium
Topic: 2024 Election Analysis

New Hampshire 2024 Presidential Election Review
Outcome
Harris +2.8% (+22,918)
My Prediction
Preface
Unlike many prognosticators, I had New Hampshire on the battlegrounds list for the duration of the election cycle and featured it in my slate of Seven Decisive States. It earned a spot on that list because President Trump pairing it with Nevada would make up for a loss of ten electoral votes elsewhere, such as Wisconsin, and provide a possible last-ditch pathway to 270 electoral votes, even if that pathway were unlikely.
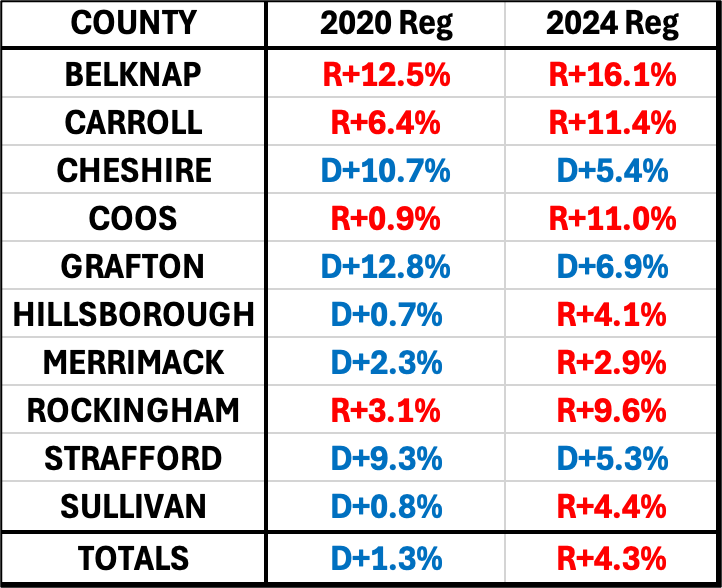
Several things made New Hampshire stand out. First, a voter roll purge cut a significant chunk out of the state’s 2020 voter roll, and of course harmed Democrats the most. That moved the state’s party registration from D+1.3% to R+4.3%.
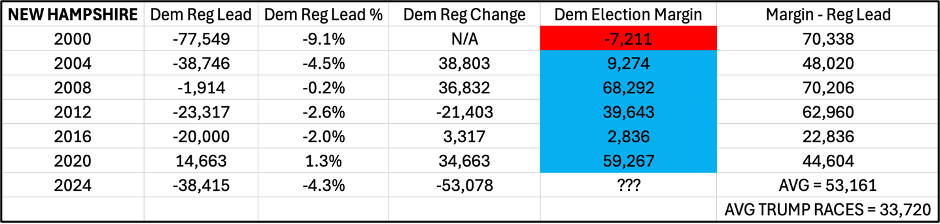
When I ran the numbers for the six previous cycles, dating back to the last GOP presidential win in the Granite State (Bush 2000), I found that the result (see final column of graphic below) was always to the left of the party registration index, and by an average of 33,720 in the two Trump races. This suggests that many left-leaners are not registered as Democrats and therefore hide out in the non-affiliated registrations, so the GOP must have a high enough registration advantage to stave off defeat in statewide races.
With a final advantage of +38,415 Republican registrations, hitting that 33,720 average would give Trump an extremely narrow win – which means his ceiling was always likely always under a point. Ultimately, I averaged out the pessimistic trend model (Harris +6.9%) and the registration model (Trump +0.6%), then split the difference toward the registration model to arrive at Harris +1.3% as my final call. Trump’s lack of personal engagement in New Hampshire informed my decision making that he thought his own campaign was much more likely to carry the bigger decisive states, so I leaned the state to Harris with roughly 2 to 1 likelihood. Trump wound up 61,333 left of the voter registration index, which has happened three times in the six preceding elections for the GOP nominee, albeit before the working-class realignment.
Analysis
· Party registration shifts since 2020 (every county shifted toward the GOP) suggested Trump would improve in all 10 counties. The party registration indicator went 10 for 10 in New Hampshire, with margins in all 10 counties more favorable to Trump than in 2020.
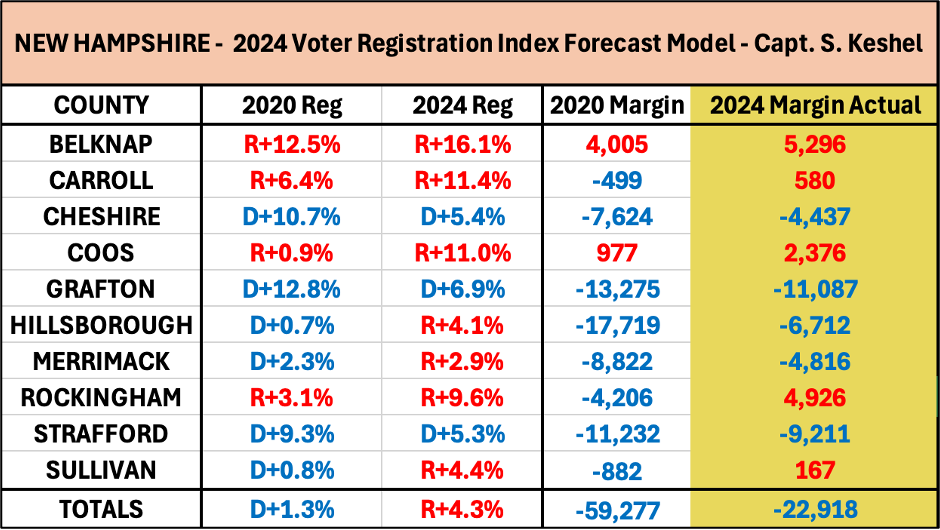
· I accurately predicted Rockingham, Carroll, and Sullivan Counties would flip to Trump.
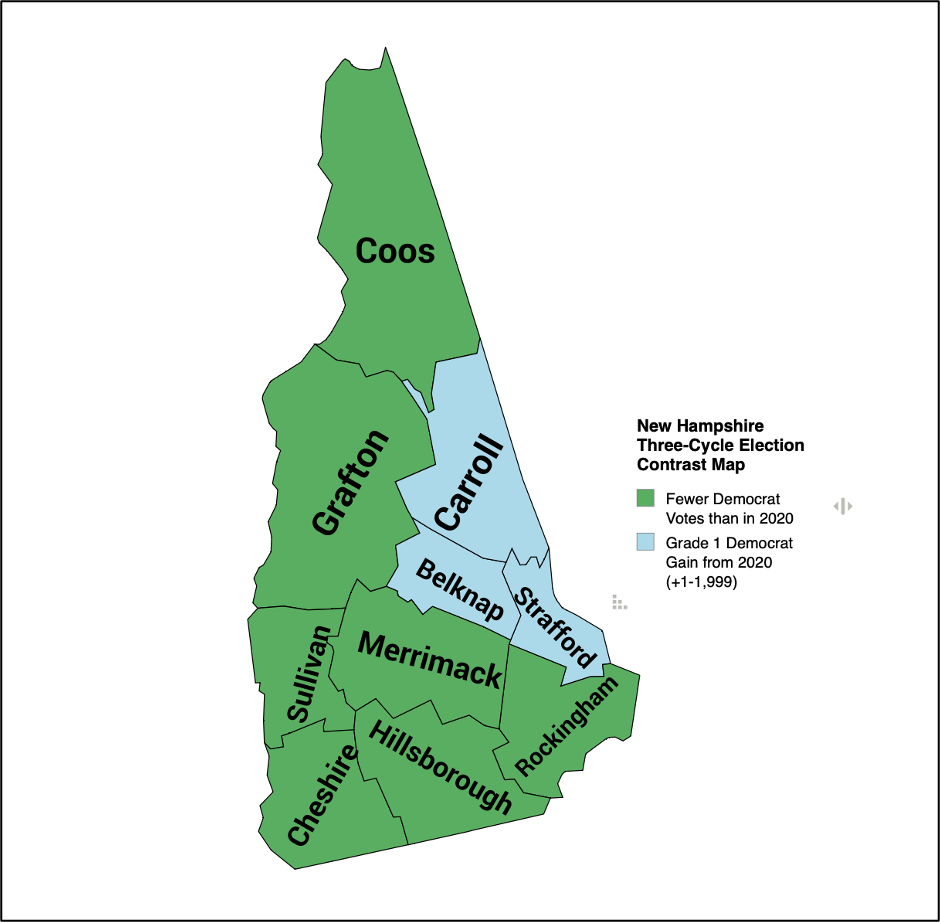
· Harris had fewer votes than Joe Biden in 7 of 10 counties. Harris made small gains in Carroll, Belknap, and Strafford Counties in the eastern portion of the state, but not large enough gains to prevent them from shifting toward Trump.
· Harris had 6,425 fewer votes statewide than Biden, and Donald Trump gained 29,877 over his previous performance, for a net shift of 36,302 (4.6%) toward Trump.
Quality Checks
Statewide Presidential Ballot Count
· 2004 677,738
· 2008 710,970 (+33,232, +4.9%)
· 2012 710,972 (+2, +0.0%)
· 2016 743,117 (+32,145, +4.3%)
· 2020 805,058 (+61,941, +8.3%)
· 2024 830,744 (+25,686, +3.2%)
Remember, I do not believe President Trump should have carried New Hampshire in a fair 2020 election, and in fact I believe the state is one of just a handful of states that present an organic shift left from its 2016 result, based on party registration shift and the fact that the first race was artificially tight thanks to Gary Johnson siphoning substantial support from Hillary Clinton. What should stand out in the statewide ballot count run from 2004 (aside from the instant double-check of a nearly identical certified ballot total in 2008 and 2012) is the abnormally large jump in ballots from 2016 to 2020, which was nearly twice as high as two preceding jumps in 2008 and 2016, despite the lowest decennial population gain since the 1940s.
