

What Does Baseball's Steroid Era Have to do with How Elections Are Run Today?
Now I know why God made me such a baseball stats geek when I was younger, because you're not going to find another read like this one.

One of the greatest memories of my childhood comes from a family trip to St. Louis at the end of September 1998. Cardinals’ first baseman Mark McGwire, one of the all-time great power hitters, had already surpassed Roger Maris’ single-season mark of 61 home runs and was in a dead heat trying to beat the Cubs’ Sammy Sosa to whatever the new record would be. Sosa went ahead 66 to 65 on that Friday night, when McGwire was squaring off against the Expos, only to be tied that same night. McGwire went on to belt two in each of the final two games to finish at an even 70, setting a new single-season record that would last for all of three years.
I watched that 70th home run fly like a cannon shot down the left field line and stood in amazement that a human being could hit so many home runs – the ultimate result of power, hand eye coordination, and a little luck. He was a behemoth of a man, 6’5” tall and by that summer, more than 250 pounds with forearms the size of a mere mortal’s thigh.
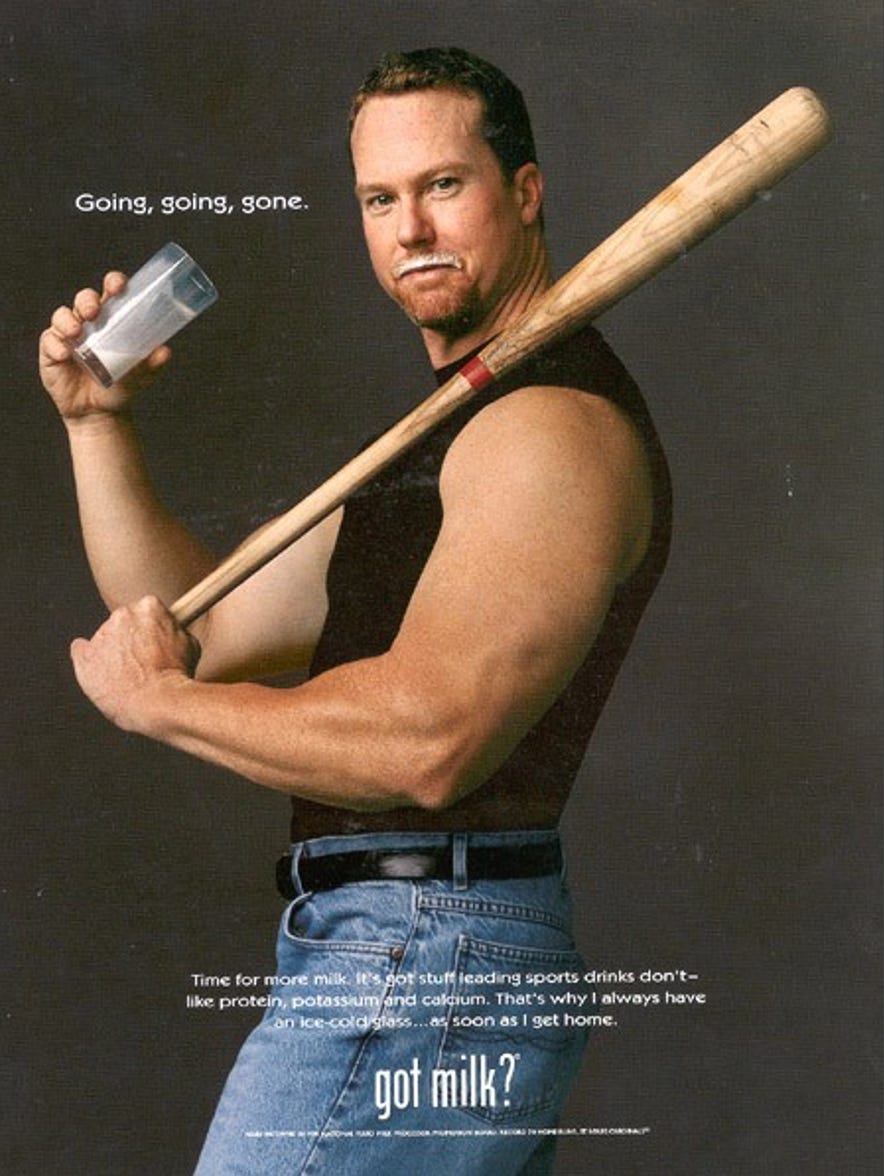
His physique had continued to broaden throughout the 1990s, offering a striking contrast to the much lankier version of himself that had come up in Oakland in the late 1980s:

That McGwire still had the stuff, belting a rookie record 49 home runs in 1987, a mark that would last for three full decades. Size and leverage are critical components of driving a baseball a long way, and McGwire had little issue doing just that until injuries caught up to him in the early 1990s. Rapid recovery from injury made his steroid routine that much more important, and the result was a 33-year-old entering his home run hitting prime as baseball desperately needed to draw fans back after it had nearly sunk itself in the aftermath of the 1994 player’s strike.
“Big Mac” probably didn’t need to be on the juice, at least not until he kept getting hurt. From 1987 through 1992, he averaged 36 home runs per season (ages 23 through 28). His 1993 and 1994 seasons were ruined by injury, but once he came back, he averaged 57 home runs per season for five seasons between 1995 and 1999.
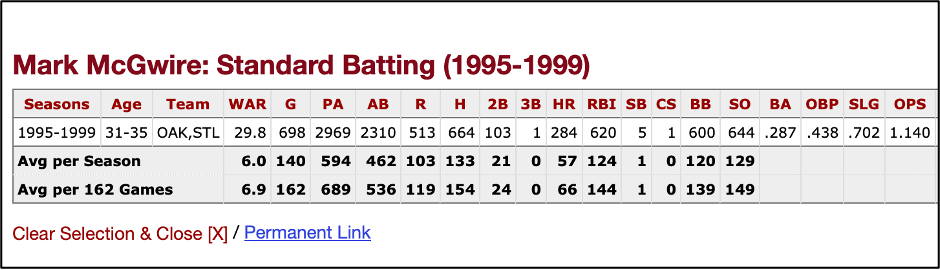
Now, McGwire had started on the steroids, which weren’t technically illegal in baseball, when he and Jose Canseco formed the vaunted Bash Brothers for the Athletics. Still, his standard home run output was somewhere in the mid-30s, with over 40 capable with good health and consistent play. In the years at the top of his physical prime (28-32), and in his mid-thirties, he turbo-charged his performance and was then capable of home run outputs in the mid-50s, ranging as high as 70.
McGwire is an admitted steroid user, but many of the most suspicious home run hitters of the steroid era haven’t been caught…yet. You may be wondering how exactly I’m making my way to political content or elections analysis by spending over 500 words on a baseball star of my childhood, but if you’re still with me, you won’t be disappointed. This piece is about forecasting.
Prior to 1995, if I’d have asked you to ballpark McGwire’s home run potential, and if you were willing to overlook his injury-marred 1993 and 1994 seasons, you’d have probably put him down for 30 or 35, with 40 possible if he enjoyed peak health. You certainly wouldn’t have envisioned him surpassing his previous career high in four of the next five seasons at ages in which most players have passed their prime playing years.
What if I asked you how many votes Democrat presidential candidates could earn in Pennsylvania in the Trump era?
Your analysis would begin like the baseball analysis – with measurements of past performance, candidate quality, polling, and traditional metrics like voter registration by party, which I’ve laid out in great detail specifically pertaining to working-class regions of Pennsylvania, like in this article. Remember, I’m a big believer in the core principle that the best indicator of future performance is past performance.
Let me paint you a picture:
2004
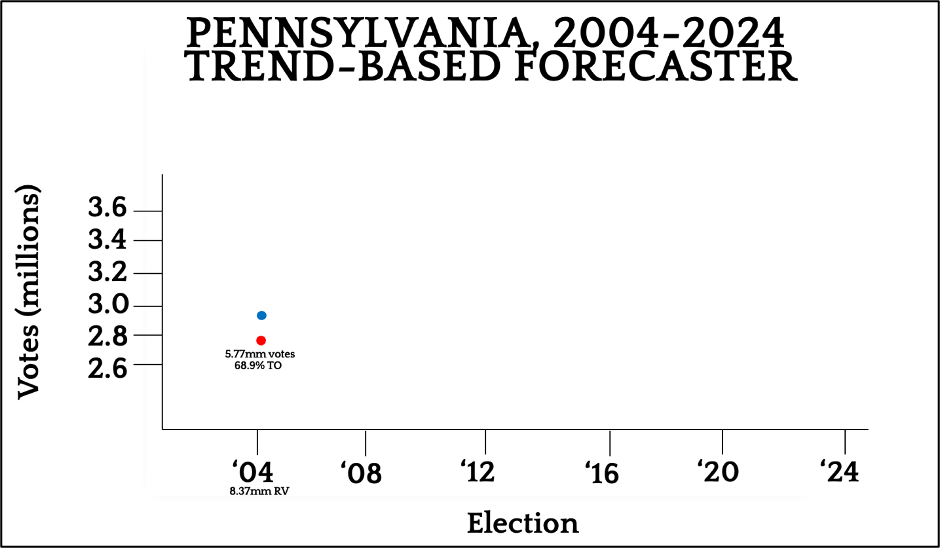
In 2004, John Kerry defeated George W. Bush by 2.5%, or 144,248 votes in a modestly close contest. There were 8.37 million registered voters, and with a total of 5.77 million votes for president cast, we have a turnout rate of 68.9% (votes/registered voters). Please note, fraudsters these days like to express turnout as votes/eligible voting population in order to keep the turnout percentage suspiciously low (rather than maxing out the registered voter count).
2008
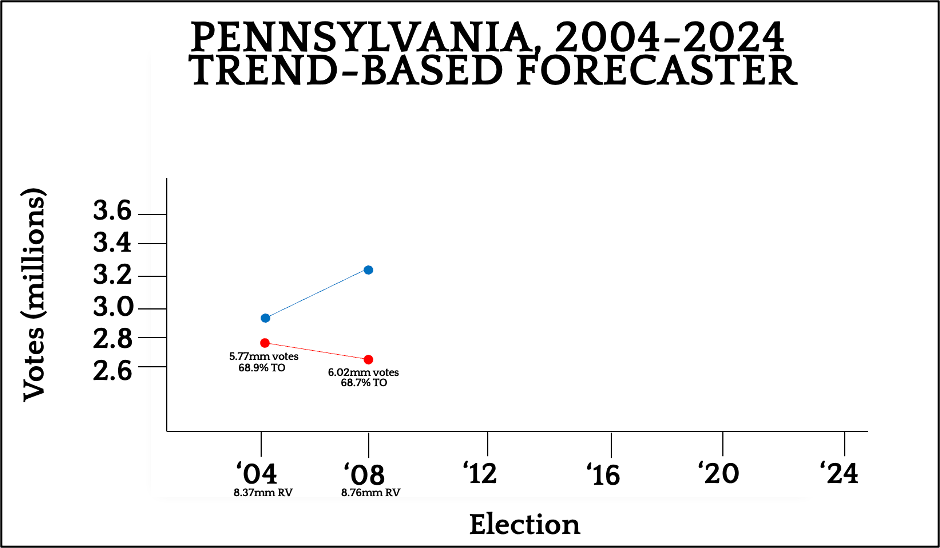
A no-brainer here that Obama would win and win big. His 10.3% margin was the largest since Johnson’s 1964 national landslide, and it was punctuated not only with his own huge gain over Kerry (+338,268), but by McCain’s utter collapse. Party registration indicated this result was likely, even though western Pennsylvania became much more Republican with Obama atop the Democrat ticket. Turnout was 68.7%, nearly identical to 2004 and with the voter roll only slightly increased on the net.
2012
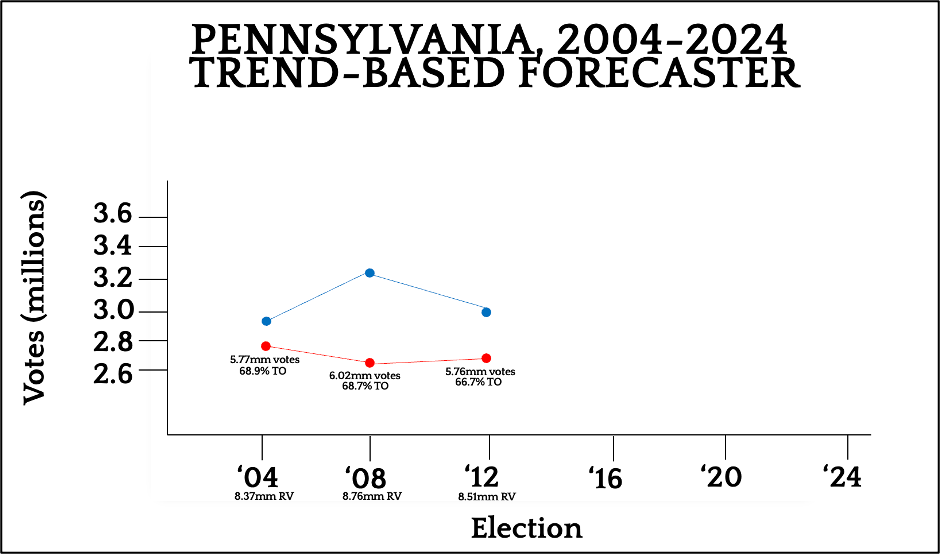
Both parties lost total registrants between 2008 and 2012, and the slight tick toward the Republican right in the overall registration index suggested a closer race than we saw in 2008. This was the case, with Obama holding Pennsylvania by just 5.4%; Romney finished well below Bush’s total from eight years before, so the margin mover was Obama’s collapse (-286,089). This collapse was foreshadowed by the Tea Party surge of 2010 and all signals that the Democrats were losing their white-working class base under a president who opposed resource extraction and blue-collar industry while favoring mass third-world immigration. Turnout was lower in terms of total votes and percentage than both previous elections, clocking in at just 66.7% with the voter roll stuck in the mid eight-millions for the third straight election.
2016
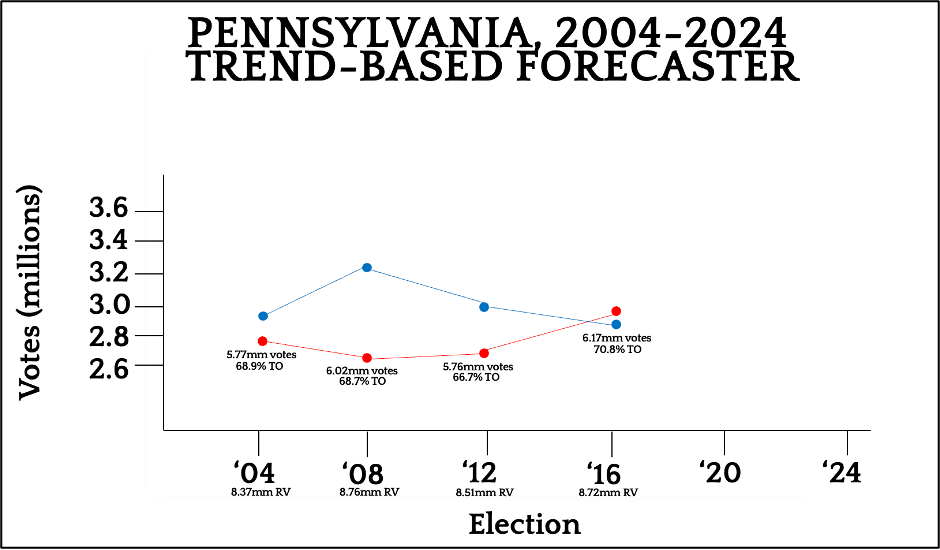
The 2016 election and the dynamics which gave Trump the state’s electoral votes for the first GOP presidential win there since 1988 are critical to understand, because I’m going to be asking you to forecast Democrat vote totals for 2020 and 2024 based on Trump’s standing and other available information from the voter roll.
